Lucas Pereira
ITI, LARSyS, Técnico Lisboa
&
prsma.com
Journal
Publication Types:
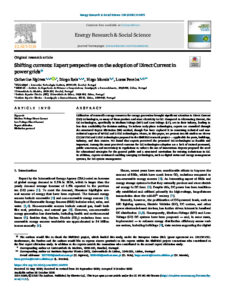
Shifting currents: Expert perspectives on the adoption of Direct Current in power grids
Abstract
Utilization of renewable energy resources for energy generation brought significant attention to Direct Current (DC) technologies, as many of them produce and store electricity in DC. Compared to Alternating Current, the DC technologies, specifically in Medium-Voltage (MV) and Low-Voltage (LV), are in their infancy, leading to less data availability for decision-making. To inform early-phase technologies, experts are consulted through the structured Expert Elicitation (EE) method, though few have explored it in examining technical and non- technical aspects of MVDC and LVDC technologies. Hence, in this paper, we present two EE studies on eleven (11) MVDC and LVDC technologies proposed in the Shift2DC research project — applicable for ports, buildings, industry, and data centers. We found that experts perceived the presented DC technologies as feasible and important. Among the most perceived concerns for DC technologies adoption are a lack of trained personnel, public awareness, and uncertainty in regulations to enforce the use of innovations. Experts proposed the need for educational strategies for the general public and a structured curriculum for training technicians in DC. In addition, experts envisioned enabling emerging technologies, such as digital twins and energy management systems, for DC system management.
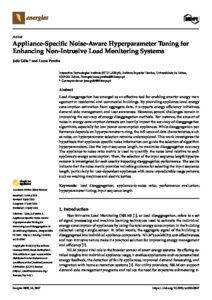
Appliance-Specific Noise-Aware Hyperparameter Tuning for Enhancing Non-Intrusive Load Monitoring Systems
Abstract
Load disaggregation has emerged as an effective tool for enabling smarter energy management in residential and commercial buildings. By providing appliance-level energy consumption estimation from aggregate data, it supports energy efficiency initiatives, demand-side management, and user awareness. However, several challenges remain in improving the accuracy of energy disaggregation methods. For instance, the amount of noise in energy consumption datasets can heavily impact the accuracy of disaggregation algorithms, especially for low-power consumption appliances. While disaggregation performance depends on hyperparameter tuning, the influence of data characteristics, such as noise, on hyperparameter selection remains underexplored. This work investigates the hypothesis that appliance-specific noise information can guide the selection of algorithm hyperparameters, like the input sequence length, to maximize disaggregation accuracy. The appliance-to-noise ratio metric is used to quantify the noise level relative to each appliance’s energy consumption. Then, the selection of the input sequence length hyperparameter is investigated for each case by inspecting disaggregation performance. The results indicate that the noise metric provides valuable guidance for selecting the input sequence length, particularly for user-dependent appliances with more unpredictable usage patterns, such as washing machines and electric kettles.
A Comprehensive Review of Clustering Methods Applications in Electric Mobility
Abstract
The continuous growth of electric vehicles (EVs) has been boosted by the need to achieve society’s decarbonization targets. The mass adoption of EVs introduces new challenges in the power systems planning and operation, mainly due to the uncertainty related to EV users’ behavior and charging needs. Some of the difficulties motivated by the uncoordinated behavior of EVs are the occurrence of voltage instabilities, system overcurrents, and harmonic distortion. In this context, clustering can help better understand and categorize the behavior of EVs and electric vehicle supply equipment (EVSE) usage, with multiple research studies devoted to the study of clustering methods to offer solutions for these problems. This manuscript comprehensively presents a review of clustering methods applications for electric mobility that focus on the possibility of identifying different groups of EV charging processes, through clustering, to provide support in characterizing EV charging profiles, EV user behavior, and EVSE accessibility and location. For that, we present a roadmap that starts with cluster analysis, in which the most utilized mathematical clustering and validation techniques are detailed. Then, several EV charging datasets are described, followed by a review of research works focusing on clustering applications in EV data, considering three main categories, namely EV charging profiles, EV user behavior, and EVSE accessibility and location.
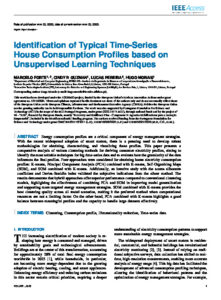
Identification of Typical Time-Series House Consumption Profiles based on Unsupervised Learning Techniques
Abstract
Energy consumption profiles are a critical component of energy management strategies. With the recent widespread adoption of smart meters, there is a pressing need to develop robust methodologies for obtaining, characterizing, and visualizing these profiles. This paper presents a comparative analysis of various clustering methods for deriving consumer electricity profiles, aiming to identify the most suitable techniques for big time-series data and the impact that the granularity of the data has on the final profiles. Four approaches were considered for obtaining house electricity consumption profiles: K-means, Principal Component Analysis (PCA) combined with K-means, Self-Organizing Maps (SOM), and SOM combined with K-means. Additionally, an iterative study with the scores silhouette coefficient and Davies-Bouldin index validated the subjective indications from the elbow method. The results demonstrate hybrid approaches with superior performance compared to conventional clustering models, highlighting the effectiveness of combining PCA and SOM to improve model generalization and support more targeted energy management strategies. SOM combined with K-means provides the best clustering quality across all tested scenarios, making it the preferred method when computational resources are not a limiting factor. On the other hand, PCA combined with K-means highlights a good balance between meaningful profiles and the capacity to handle large datasets effectively.
Unveiling energy usage patterns in industrial kitchens: From detection to clustering of appliance usage
Abstract
Industrial Kitchens (IKs) are characterized by high energy consumption, yet they remain largely overlooked in energy research. Understanding how electricity is used in IKs is crucial for identifying opportunities for energy optimization and improving sustainability in this sector. This paper presents a data-driven methodology for analyzing appliance consumption by automatically detecting and classifying appliance activations. The approach combines automatic activity detection with unsupervised clustering to reveal usage patterns. Evaluated on data from nine IK appliances, the methodology achieves outstanding performance, with average balanced accuracy and F1-scores exceeding 0.98. The unsupervised classification identifies distinct cycle modes for each appliance, with the optimal number of clusters varying across appliances. Load fluctuation patterns are found to be the most significant feature, with appliances like the ice machine exhibiting unique consumption behaviors compared to similar appliances like refrigerators. In contrast, appliances such as the salamander draw power consistently, regardless of activity duration. These findings not only contribute to a better understanding of energy use in IKs but also lay the groundwork for future research on demand response strategies and energy efficiency improvements in small-scale commercial kitchens.
Leveraging Explainable Artificial Intelligence in Solar Photovoltaic Mappings: Model Explanations and Feature Selection
Abstract
This work explores the effectiveness of explainable artificial intelligence in mapping solar photovoltaic power outputs based on weather data, focusing on short-term mappings. We analyzed the impact values provided by the Shapley additive explanation method when applied to two algorithms designed for tabular data—XGBoost and TabNet—and conducted a comprehensive evaluation of the overall model and across seasons. Our findings revealed that the impact of selected features remained relatively consistent throughout the year, underscoring their uniformity across seasons. Additionally, we propose a feature selection methodology utilizing the explanation values to produce more efficient models, by reducing data requirements while maintaining performance within a threshold of the original model. The effectiveness of the proposed methodology was demonstrated through its application to a residential dataset in Madeira, Portugal, augmented with weather data sourced from SolCast.
Crafting Taxonomies for Understanding Power Consumption in Industrial Kitchens: A Methodological Framework and Real-World Application
Abstract
Although industrial kitchens consume significantly more energy than other commercial buildings and represent an important opportunity for sustainable energy systems, researchers have largely overlooked energy efficiency in these spaces. One of the main challenges is the diversity of kitchen configurations, complicating the characterization and generalization of research findings, including establishing a standardized methodology for assessing and benchmarking energy demand. To address this research gap, this paper proposes a methodological framework to develop taxonomies for understanding the electricity consumption in industrial kitchens. The proposed framework was developed following an extensive survey of the existing literature, and it is based on four main steps: identification of the knowledge domain, extraction of terms and concepts, data collection, and information analysis. To demonstrate the proposed framework, a case study was developed involving the participation of 50 restaurants located in Portugal. The proposed framework proved valid as it enabled the construction of a taxonomy that allows the classification of industrial kitchens according to different energy consumption-related concepts, such as costs with energy, the physical size of the kitchen, and the number of workers.
Metaheuristic Optimization Methods in Energy Community Scheduling: A Benchmark Study
Abstract
The prospect of the energy transition is exciting and sure to benefit multiple aspects of daily life. However, various challenges, such as planning, business models, and energy access are still being tackled. Energy Communities have been gaining traction in the energy transition, as they promote increased integration of Renewable Energy Sources (RESs) and more active participation from the consumers. However, optimization becomes crucial to support decision making and the quality of service for the effective functioning of Energy Communities. Optimization in the context of Energy Communities has been explored in the literature, with increasing attention to metaheuristic approaches. This paper contributes to the ongoing body of work by presenting the results of a benchmark between three classical metaheuristic methods—Differential Evolution (DE), the Genetic Algorithm (GA), and Particle Swarm Optimization (PSO)—and three more recent approaches—the Mountain Gazelle Optimizer (MGO), the Dandelion Optimizer (DO), and the Hybrid Adaptive Differential Evolution with Decay Function (HyDE-DF). Our results show that newer methods, especially the Dandelion Optimizer (DO) and the Hybrid Adaptive Differential Evolution with Decay Function (HyDE-DF), tend to be more competitive in terms of minimizing the objective function. In particular, the Hybrid Adaptive Differential Evolution with Decay Function (HyDE-DF) demonstrated the capacity to obtain extremely competitive results, being on average 3% better than the second-best method while boasting between around 2× and 10× the speed of other methods. These insights become highly valuable in time-sensitive areas, where obtaining results in a shorter amount of time is crucial for maintaining system operational capabilities.
Efficiency through Simplicity: MLP-based Approach for Net-Load Forecasting with Uncertainty Estimates in Low-Voltage Distribution Networks
Abstract
Power demand forecasting is becoming a crucial tool for the planning and operation of Low Voltage (LV) distribution systems. Most importantly, the high penetration of Photovoltaics (PV) power generation as part of Distributed Energy Resource (DER)s has transformed the power demand forecasting problem at the distribution level into net-load forecasting. This paper introduces a novel and scalable approach to probabilistic forecasting at LV substation with PV generation. It presents a multi-variates probabilistic forecasting approach, leveraging Quantile Regression (QR). The proposed architecture uses a computationally efficient feed-forward neural net to capture the complex interaction between the historical load demands and covariate variables such as solar irradiance. It is empirically demonstrated that the proposed method can efficiently produce well-calibrated forecasts, both auto-regressively or in a single forward pass. Furthermore, a benchmark against four state-of- the-art forecasting approaches shows that the proposed approach offers a desirable trade-off between forecasting accuracies, calibrated uncertainty, and computation complexity.
Industrial kitchen appliance consumption forecasting: Hour-ahead and day-ahead perspectives with post-processing improvements
Abstract
Forecasting techniques have gained considerable prominence within the electric energy sector. Many studies have been documented in the literature, addressing various facets of the energy grid, ranging from power generation to end-user consumption. However, it is noteworthy that the prediction of individual appliance demand has remained relatively unexplored despite its increasing significance, particularly in modern power grids characterized by a dominant presence of distributed energy resources. In light of this research gap, this work focuses on developing and evaluating methodologies for forecasting active power consumption at the device level in the context of industrial kitchens. Three post-processing algorithms are also proposed to improve the forecasting accuracy by leveraging historical predictions. A comprehensive case study employing sub-metered data from 15 industrial kitchen devices was conducted to validate the proposed methods, spanning both hour-ahead and day-ahead scenarios. The results demonstrate the effectiveness of the proposed methods in both forecasting horizons, particularly of the post-processing techniques that show average improvements of over 30% in day-ahead and 50% in hour-ahead, compared to the original predictions.
Distributed Platform for Offline and Online EV Charging Simulation
Abstract
Efforts to enhance electric vehicle (EV) charging processes have spurred the emergence of smart charging algorithms. However, these studies are intricate and costly, necessitating preliminary simulations to assess EV integration into power grids. Existing solutions to this issue tend to be limited to academia and proprietary systems. To address this, we propose a user-friendly and intuitive simulation tool employing a decoupled and flexible architecture. This architecture, achieved through open design and containerized microservices, streamlines maintenance, extension, and scalability. We substantiated the validity of our solution by simulating the charging infrastructure from an H2020 Research Project. Furthermore, we integrated our solution with an external system that executes smart charging algorithms. The proposed system yielded the desired results, enabling the project team to evaluate both the integration and algorithms, even amidst the COVID-19 lockdown.

PyECOM: A Python tool for analysing and simulating Energy Communities
Abstract
Python Energy Communities (PyECOM) is a tool designed to facilitate the research into Energy Communities (EC) through the ability to create, simulate, and test various EC settings. Key components of EC functioning are implemented and provide a flexible basis for the integration of new components. Optimization algorithms from libraries such as Pymoo can be accessed and are facilitated through the use of the proposed data model. In future versions, PyECOM will also feature Reinforcement Learning as a method available to the users.
FIKElectricity: A Electricity Consumption Dataset from Three Restaurant Kitchens in Portugal
Abstract
Industrial Kitchens are very energy-intensive businesses, consuming between five and seven times more energy per square meter than other commercial spaces like office spaces and retail stores. Still, very little research has been carried out on improving the energy efficiency of this industry. This paper presents the FIKElectricity dataset, a collection of electricity data from three Portuguese restaurant kitchens during their daily operation. The duration of the datasets spans three to four weeks in each industrial kitchen and comprises aggregated and individual appliance consumption, collected at 1Hz and $\frac{1}{5}$Hz, respectively. The public release of FIKElectricity is expected to draw more attention from the research community to this overlooked industrial sector. The data collection and post-processing methods are thoroughly described in this paper, as well as the dataset organization. Examples showing the dataset’s quality and instructions for its reuse are also provided.
Link to Dataset: https://osf.io/k3g8n/
On the Potential of Tertiary Espresso Machines to Provide Frequency Containment Reserves Services
Abstract
The increase of renewables in the electricity mix is changing how power systems operate and adding new players to the energy markets. In a very short time, it is expected that aggregators can provide balancing services that leverage the flexibility of small and medium-sized consumers. This paper presents a study that assesses the potential of using professional espresso machines to provide Demand-Side Flexibility (DSF) services and, more concretely, Frequency Containment Reserves (FCR). The proposed methodology takes advantage of the coffee and steam boiler components of the coffee machine to identify opportunities to reduce the electricity demand, hence providing demand-side flexibility. The proposed methodology is evaluated using synthetic data generated from a dataset initially collected from an original professional espresso coffee machine during its daily operation. The results show that for a group of 100 coffee machines, the disposable power through the day would vary from 33 kW in the nighttime to 42 kW between 10 AM and 6 PM. The results also show that a minimum of 10 coffee machines are necessary to establish a non-zero disposable power and that after about 30 coffee machines are aggregated, the achievable disposable power becomes nearly linear.
ANR: A New Metric to Quantify the Appliance to Noise Ratio in Load Disaggregation Datasets
Abstract
Non-intrusive Load Monitoring (NILM), or load disaggregation, aims to decompose aggregate power consumption into appliance components. Factors such as noise power affect algorithm performance, reducing accuracy and increasing complexity. While existing literature often relies on standard machine learning metrics to report noise power proportion in aggregate consumption, these are overall measures that do not specify the ratio between appliance consumption and noise power. This paper proposes a noise metric that assesses the proportion of dataset noise relative to an appliance’s consumption in NILM. The proposed metric’s sensitivity and applicability are assessed for different data scenarios using a real-world dataset. Additionally, the paper explores a potential association between the proposed metric and disaggregation performance is also inspected. Furthermore, the proposed metric is compared to existing noise metrics to highlight its unique contributions. The results demonstrate that the proposed metric effectively quantifies noise proportion with respect to specific appliances across various data scenarios. It exhibits robustness to suitable granularity variations and complements other noise metrics in interpreting NILM experiments.
PROCSIM: An Open-Source Simulator to Generate Energy Community Power Demand and Generation Scenarios
Abstract
Opportunities and Challenges for Small-Scale Flexibility in European Electricity Markets
Abstract
The increase of renewables in the electricity mix in Europe in the last years and the plans to shut down coal-fired power plants will change the power system operation rules. Expectations are that small unit aggregators can soon provide flexibility and balancing services in several European countries. This paper aims to perform a qualitative comparison of European market rules for small-scale-scale flexibility. The work focused more specifically on the prequalification process that the Balancing Service Providers should develop to participate in Frequency Containment Reserve Services and the specific needs of the small-scale flexibility and balancing providers. Five countries were chosen for the analysis: Switzerland, Belgium, Germany, Portugal, and Spain. Of the five countries compared, the one that appears to have fewer entry barriers and shows greater possibilities of working on a case-to-case basis is Switzerland, followed by Belgium and Germany. Portugal and Spain are developing their ancillary service markets and should soon allow the participation of small-scale balancing providers in ancillary services.
Benchmark of Electricity Consumption Forecasting Methodologies Applied to Industrial Kitchens
Abstract
Even though Industrial Kitchens (IKs) are among the highest energy intensity spaces, very little work has been done to forecast their consumption. This work explores the possibility of increasing the accuracy of the consumption forecast in an IK by forecasting disaggregated appliance consumption and comparing these results with the forecast of the total consumption of these appliances (Virtual Aggregate—VA). To do so, three different methods are used: the statistical method (Prophet), classic Machine Learning (ML) method such as random forest (RF), and deep learning (DL) method, namely long short-term memory (LSTM). This work uses individual appliance electricity consumption data collected from a Portuguese restaurant over a period of four consecutive weeks. The obtained results suggest that Prophet and RF are the more viable options. The former achieved the best performance in aggregated data, whereas the latter showed better forecasting results for most of the individual loads. Regarding the performance of the VA against the sum of individual appliance forecasts, all models perform better in the former. However, the very small difference across the results shows that this is a viable alternative to forecast aggregated consumption when only individual appliance consumption data are available.
Unlocking the Full Potential of Neural NILM: On Automation, Hyperparameters & Modular Pipelines
Abstract
Non-Intrusive Load Monitoring (NILM) techniques are increasingly becoming a key instrument for identifying the power consumption of individual appliances based on a single metering point. Particularly Deep learning models are gaining interest in this regard. However, the challenges brought by NILM datasets and the non-availability of common experimental guidelines tend to compromise comparison, research transparency, and replicability. The limited adoption of efficient research instruments and a lack of best practices guidelines contribute in huge part to this problem, where no features, encouraging standardized formats for benchmarking and results sharing, are offered. To address these issues, we first present a brief overview of recent best practices for Deep Learning (DL) and highlight how deep NILM research can benefit from these practices. Furthermore, we suggest a novel open-source toolkit leveraging these practices: Deep-NILMTK. The proposed toolkit offers a common testing bed for NILM algorithms independently of the underlying deep learning framework with a modular NILM pipeline that can easily be customized. Furthermore, Deep-NILMTK introduces the concept of Experiment Templating to offer pre-designed experiments allowing to enhance research efficiency. Leveraging this concept and DL best practices, we present a case study of creating an online NILM benchmark repository.
A Data-Centric Analysis of the Impact of Non-Electric Data on the Performance of Load Disaggregation Algorithms
Abstract
Recent research on non-intrusive load monitoring, or load disaggregation, suggests that the performance of algorithms can be affected by factors beyond energy data. In particular, by incorporating non-electric data in load disaggregation analysis, such as building and consumer characteristics, the estimation accuracy of consumption data may be improved. However, this association has rarely been explored in the literature. This work proposes a data-centric methodology for measuring the effect of non-electric characteristics on load disaggregation performance. A real-world dataset is considered for evaluating the proposed methodology, using various appliances and sample rates. The methodology results indicate that the non-electric characteristics may have varying effects on the performances of different building appliances. Therefore, the proposed methodology can be relevant for complementing load disaggregation analysis.
A Data Model and File Format to Represent and Store High Frequency Energy Monitoring and Disaggregation Datasets
Abstract
There is a generalized consensus in the Non-Intrusive Load Monitoring research community on the importance of public datasets for improving this research field. Still, despite the considerable efforts to release public data, what is currently available suffers from serious issues, among which is the lack of widely accepted data models and common interfaces to access the currently available and future datasets. This paper proposes the Energy Monitoring and Disaggregation Data Format (EMD-DF64). EMD-DF64 is a data model, file format, and application programming interface developed to provide a unique interface to create, manage, and access high-frequency (>=1Hz) electric energy consumption datasets. More precisely, the present paper describes the data model and its respective implementation, which was done by leveraging the well-known Sony WAVE64 format that supports the storage of audio data and metadata annotations.
Impact of Forecasting Models Errors in a Peer-to-Peer Energy Sharing Market
Abstract
The use of energy sharing models in smart grids has been widely addressed in the literature. However, feasible technical solutions that can deploy these models into reality, as well as the correct use of energy forecasts are not properly addressed. This paper proposes a simple, yet viable and feasible, solution to deploy energy management systems on the end-user-side in order to enable not only energy forecasting but also a distributed discriminatory-price auction peer-to-peer energy transaction market. This work also analyses the impact of four energy forecasting models on energy transactions: a mathematical model, a support vector machine model, an eXtreme Gradient Boosting model, and a TabNet model. To test the proposed solution and models, the system was deployed in five small offices and three residential households, achieving a maximum energy costs reduction of 10.89% within the community, ranging from 0.24% to 57.43% for each individual agent. The results demonstrated the potential of peer-to-peer energy transactions to promote energy cost reductions and enable the validation of auction-based energy transactions and the use of energy forecasting models in today’s buildings and end-users.
Privacy Protection in Smart Meters using Homomorphic Encryption: an overview
Abstract
This paper presents an overview of the literature on privacy protection in smart meters with a particular focus on Homomorphic Encryption (HE). Firstly, we introduce the concept of smart meters, the context in which they are inserted, the main concerns, and oppositions inherent to their use. Later,}an overview of privacy protection is presented, emphasizing the need to safeguard the privacy of smart-meter users by identifying, describing, and comparing the main approaches that seek to address this problem. Then, two privacy protection approaches based on HE are presented in more detail and additionally we present two possible application scenarios. Finally, the paper concludes with a brief overview of the unsolved challenges in HE and the most promising future research directions.
A Residential Labeled Dataset for Smart Meter Data Analytics
Abstract
Smart meter data is a cornerstone for the realization of next-generation electrical power grids by enabling the creation of novel energy data-based services like providing recommendations on how to save energy or predictive maintenance of electric appliances. Most of these services are developed on top of advanced machine-learning algorithms, which rely heavily on datasets for training, testing, and validation purposes. A limitation of most existing datasets, however, is the scarcity of labels. The SustDataED2 dataset described in this paper contains 96 days of aggregated and individual appliance consumption from one household in Portugal. The current and voltage waveforms were sampled at 12.8 kHz, and the individual consumption of 18 appliances was sampled at 0.5 Hz. The dataset also contains the timestamps of the ON-OFF transitions of the monitored appliances for the entire deployment duration, providing the necessary ground truth for the evaluation of machine learning problems, particularly Non-Intrusive Load Monitoring. The data is accessible in easy-to-use audio and comma-separated formats.
FPSeq2Q: Fully Parameterized Sequence to Quantile Regression for Net-Load Forecasting with Uncertainty Estimates
Abstract
The increased penetration of Renewable Energy Sources (RES) as part of a decentralized and distributed power system makes net-load forecasting a critical component in the planning and operation of power systems. However, compared to the transmission level, producing accurate short-term net-load forecasts at the distribution level is complex due to the small number of consumers. Moreover, owing to the stochastic nature of RES, it is necessary to quantify the uncertainty of the forecasted net-load at any given time, which is critical for the real-world decision process. This work presents parameterized deep quantile regression for short-term probabilistic net-load forecasting at the distribution level. To be precise, we use a Deep Neural Network (DNN) to learn both the quantile fractions and quantile values of the quantile function. Furthermore, we propose a scoring metric that reflects the trade-off between predictive uncertainty performance and forecast accuracy. We evaluate the proposed techniques on historical real-world data from a low-voltage distribution substation and further assess its robustness when applied in real-time. The experiment’s outcomes show that the resulting forecasts from our approach are well-calibrated and provide a desirable trade-off between forecasting accuracies and predictive uncertainty performance that are very robust even when applied in real-time.
A Novel Methodology for Identifying Appliance Usage Patterns in Buildings Based on Auto-Correlation and Probability Distribution Analysis
Abstract
In today’s society, a current concern is to mitigate the risks of global climate change. Throughout the years there have been several initiatives to achieve more sustainable energy distribution in buildings. In this work, a new methodology is proposed for identifying appliance consumption patterns in buildings. It consists of, at first, conducting a seasonality analysis based on the Auto-Correlation Function for detecting the different appliance use patterns that arise in a given time window. Then, it is conducted a Probability Distribution Analysis based on the auto-correlation results and the calculation of an informative measure to select the prevailing consumption pattern. The methodology enables to distinguish between different use patterns for a given appliance for each building at specific time intervals, e.g., the seasons of the year. For the purpose of illustration, the methodology is applied to consumption data of four appliances selected from a domestic energy consumption dataset (REFIT) over one year. The results provide several insights on how a given appliance use evolves throughout the seasons for each household, and also highlighting use similarity for different appliances across the seasons. These results would be, otherwise, hidden away, and would require an individual analysis of consumption patterns of each appliance. Consequently, the methodology provides a consistent mechanism to identify different user profiles.
Energy Monitoring in the Wild: platform development and lessons learned from a real-world demonstrator
Abstract
This paper presents the development and evaluation of EnnerSpectrum, a platform for electricity monitoring. The development was motivated by a gap between academic, fully custom-made monitoring solutions and commercial proprietary monitoring approaches. EnnerSpectrum is composed of two main entities, the back end, and the Gateway. The back end is a server comprised of flexible entities that can be configured to different monitoring scenarios. The Gateway interacts with equipment at a site that cannot interact directly with the back end. The paper presents the architecture and configuration of EnnerSpectrum for a long-term case study with 13 prosumers of electricity for approximately 36 months. During this period, the proposed system was able to adapt to several building and monitoring conditions while acquiring 95% of all the available consumption data. To finalize, the paper presents a set of lessons learned from running such a long-term study in the real world.
FIKWater: A Water Consumption Dataset from Three Restaurant Kitchens in Portugal
Abstract
With the advent of IoT and low-cost sensing technologies, the availability of data has reached levels never imagined before by the research community. However, independently of its size, data is only as valuable as the ability to have access to it. This paper presents the FIKWater dataset, which contains time series data for hot and cold water demand collected from three restaurant kitchens in Portugal for consecutive periods between two and four weeks. The measurements were taken using ultrasonic flow meters, at a sampling frequency of 15Hz. Additionally, some details of the monitored spaces are also provided.
FIKWaste: A Waste Generation Dataset from Three Restaurant Kitchens in Portugal
Abstract
In the era of big data and artificial intelligence, public datasets are becoming increasingly important for researchers to build and evaluate their models. This paper presents the FIKWaste dataset, which contains time series data for the volume of waste produced in three restaurant kitchens in Portugal. Glass, paper, plastic, and undifferentiated waste bins were monitored for consecutive periods of four weeks. In addition to the time-series measurements, the FIKWaste dataset contains labels for waste disposal events, i.e., when the waste bins are emptied, and technical and non-technical details of the monitored kitchens.
Watt’s up at Home? Smart Meter Data Analytics from a Consumer-Centric Perspective
Abstract
The key advantage of smart meters over traditional metering devices is their ability to transfer consumption information to remote data processing systems. Besides enabling the automated collection of a customer’s electricity consumption for billing purposes, the data collected by these devices makes the realization of many novel use cases possible.
However, the large majority of such services are tailored to improve the power grid’s operation as a whole.
For example, forecasts of household energy consumption or photovoltaic production allow for improved power plant generation scheduling. Similarly, the detection of anomalous consumption patterns can indicate electricity theft and serve as a trigger for corresponding investigations. Even though customers can directly influence their electrical energy consumption, the range of use cases to the users’ benefit remains much smaller than those that benefit the grid in general.
In this work, we thus review the range of services tailored to the needs of end-customers. By briefly discussing their technological foundations and their potential impact on future developments, we highlight the great potentials of utilizing smart meter data from a user-centric perspective. Several open research challenges in this domain, arising from the shortcomings of state-of-the-art data communication and processing methods, are furthermore given. We expect their investigation to lead to significant advancements in data processing services and ultimately raise the customer experience of operating smart meters.
Economic Assessment of Solar-Powered Residential Battery Energy Storage Systems: the case of Madeira Island, Portugal
Abstract
This paper presents an economic assessment of introducing solar-powered residential battery energy storage in the Madeira Island electric grid, where only micro-production for self-consumption is currently allowed. The evaluation was conducted against six local micro-producers using one year of energy consumption and solar photovoltaic production measurements and two distinct storage control strategies. Several inverter sizes and storage capacities were considered based on the six micro-producers’ consumption and production profiles. The results were then analyzed concerning year-long simulations and a projection for the next ten years. To this end, several indicators were assessed, including self-consumption, profit per Euro invested, number of cycles, and storage degradation. The results obtained show that despite the benefits of storage to increase the self-consumption rates, considerable drops in the storage prices are still necessary to achieve profitability during these devices’ lifetime. Furthermore, our results also highlight a very interesting trade-off between self-consumption, pre-charge, and profitability, in a sense that higher levels of pre-charge increase the chances of reaching profitability even though this will imply considerable drops in the levels of self-consumption.
An Empirical Exploration of Performance Metrics for Event Detection Algorithms in Non-Intrusive Load Monitoring
Adaptive Weighted Recurrence Graphs for Appliance Recognition in Non-Intrusive Load Monitoring
Multi-label Learning for Appliance Recognition in NILM using Fryze-Current Decomposition and Convolutional Neural Network
Abstract
The advance in energy-sensing and smart-meter technologies have motivated the use of a Non-Intrusive Load Monitoring (NILM), a data-driven technique that recognizes active end-use appliances by analyzing the data streams coming from these devices. NILM offers an electricity consumption pattern of individual loads at consumer premises, which is crucial in the design of energy efficiency and energy demand management strategies in buildings. Appliance classification, also known as load identification is an essential sub-task for identifying the type and status of an unknown load from appliance features extracted from the aggregate power signal. Most of the existing work for appliance recognition in NILM uses a single-label learning strategy which, assumes only one appliance is active at a time. This assumption ignores the fact that multiple devices can be active simultaneously and requires a perfect event detector to recognize the appliance. In this paper proposes the Convolutional Neural Network (CNN)-based multi-label learning approach, which links multiple loads to an observed aggregate current signal. Our approach applies the Fryze power theory to decompose the current features into active and non-active components and use the Euclidean distance similarity function to transform the decomposed current into an image-like representation which, is used as input to the CNN. Experimental results suggest that the proposed approach is sufficient for recognizing multiple appliances from aggregated measurements.
Resources
Improved Appliance Classification in Non-Intrusive Load Monitoring Using Weighted Recurrence Graph and Convolutional Neural Networks
Abstract
Appliance recognition is one of the vital sub-tasks of NILM in which a machine learning classier is used to detect and recognize active appliances from power measurements. The performance of the appliance classifier highly depends on the signal features used to characterize the loads. Recently, different appliance features derived from the voltage–current (V–I) waveforms have been extensively used to describe appliances. However, the performance of V–I-based approaches is still unsatisfactory as it is still not distinctive enough to recognize devices that fall into the same category. Instead, we propose an appliance recognition method utilizing the recurrence graph (RG) technique and convolutional neural networks (CNNs). We introduce the weighted recurrent graph (WRG) generation that, given one-cycle current and voltage, produces an image-like representation with more values than the binary output created by RG. Experimental results on three different sub-metered datasets show that the proposed WRG-based image representation provides superior feature representation and, therefore, improves classification performance compared to V–I-based features.
Resources
PB-NILM: PinBall Guided Deep Non-Intrusive Load Monitoring
Abstract
The work in this paper proposes the application of the pinball quantile loss function to guide a deep neural network for Non-Intrusive Load Monitoring. The proposed architecture leverages concepts such as Convolution Neural Networks and Recurrent Neural Networks. For evaluation purposes, this paper also presents a set of complementary performance metrics for energy estimation. Finally, this paper also reports on the results of a comprehensive benchmark between the proposed network and three alternative deep neural networks, when guided by the pinball and Mean Squared Error loss functions. The obtained results confirm the disaggregation superiority of the proposed system, while also showing that the performances obtained using the pinball loss function are consistently superior to the ones obtained using the Mean Squared Error loss.
Resources
Arbitrage with Power Factor Correction using Energy Storage
Abstract
The importance of reactive power compensation for power factor (PF) correction will significantly increase with the large-scale integration of distributed generation interfaced via inverters producing only active power. In this work, we focus on co-optimizing energy storage for performing energy arbitrage as well as local power factor correction. The joint optimization problem is non-convex, but can be solved efficiently using a McCormick relaxation along with penalty-based schemes. Using numerical simulations on real data and realistic storage profiles, we show that energy storage can correct PF locally without reducing arbitrage profit. It is observed that active and reactive power control is largely decoupled in nature for performing arbitrage and PF correction (PFC). Furthermore, we consider a real-time implementation of the problem with uncertain load, renewable and pricing profiles. We develop a model predictive control based storage control policy using auto-regressive forecast for the uncertainty. We observe that PFC is primarily governed by the size of the converter and therefore, look-ahead in time in the online setting does not affect PFC noticeably. However, arbitrage profit is more sensitive to uncertainty for batteries with faster ramp rates compared to slow ramping batteries.
Resources
Understanding the practical issues of deploying energy monitoring and eco-feedback technology in the wild: Lesson learned from three long-term deployments
Abstract
This paper reports on the different engineering, social and financial challenges behind the building and deploying electric energy monitoring and eco-feedback technology in real-world scenarios, which despite being relevant to the research community are seldom reported in the literature. The objectives of this paper are two-fold: First, discuss the technical and social constraints of real-world deployments. This includes, for example, hardware and software requirements, and issues related to security and intrusiveness of the monitoring solutions. Second, identify and understand the costs associated with developing and deploying such systems. These include hardware costs and consumed energy. To this end, we rely on over five years of experience developing and improving a non-intrusive energy monitoring research platform to enable the deployment of long and short-term studies of eco-feedback technology. During this time, two versions of that platform were deployed in 50 homes for periods that lasted between 6 and 18 consecutive months. By iteratively developing and deploying our sensing and eco-feedback infrastructures, we managed to build upon previous findings and lessons learned to understand how to create, deploy, and maintain such systems. Concurrently, we gained insights regarding what are some of the most relevant costs associated with running such experiments.
Supplementary Material

NILMPEds: A Performance Evaluation Dataset for Event Detection Algorithms in Non-Intrusive Load Monitoring
dsCleaner: A Python Library to Clean, Preprocess and Convert Non-Intrusive Load Monitoring Datasets
A global monitoring system for electricity consumption and production of household roof-top PV systems in Madeira
Implementation Strategy of Convolution Neural Networks on Field Programmable Gate Arrays for Appliance Classification Using the Voltage and Current (V-I) Trajectory
Performance Evaluation in Non-Intrusive Load Monitoring: datasets, metrics and tools - a review
Understanding families’ motivations for sustainable behaviors